Project Summary
The following projects analyze different environmental phenomena using remote sensing techniques with Landsat imagery:
| Project | Location | Period | Index used | Satellite | Product |
|---|---|---|---|---|---|
| Deforestation | Joaquín V. González, Salta | 1986–2017 | NDVI | Landsat 5 / Landsat 8 | Land cover change map |
| Fires | Lago Cholila, Chubut | January–April 2015 | NBR / ΔNBR | Landsat 8 | Burn severity map |
| Glaciers/Snow | Cerro de la Majadita, San Juan | 2018 (seasonal) | Snow Index (SI) | Landsat 8 | Seasonal dynamics map |
1. Deforestation in northwest Argentina
The Chaco Salteño region has experienced significant transformation due to agricultural expansion. This analysis quantifies the loss of native forest around Joaquín V. González between 1986 and 2017.
Methodology
- Download of Landsat 5 (1986) and Landsat 8 (2017) images, path 230, row 77.
- Calculation of the Normalized Difference Vegetation Index (NDVI) for each date:
NDVI Formula:
NDVI = (NIR - Red) / (NIR + Red)
- Unsupervised classification (k-means, 3 classes) of stacked NDVI.
- Category assignment:
- Green: Preserved vegetation (high NDVI without change).
- Orange: Areas with decreased NDVI due to forest loss.
- Yellow: Low vegetation zones without significant changes.
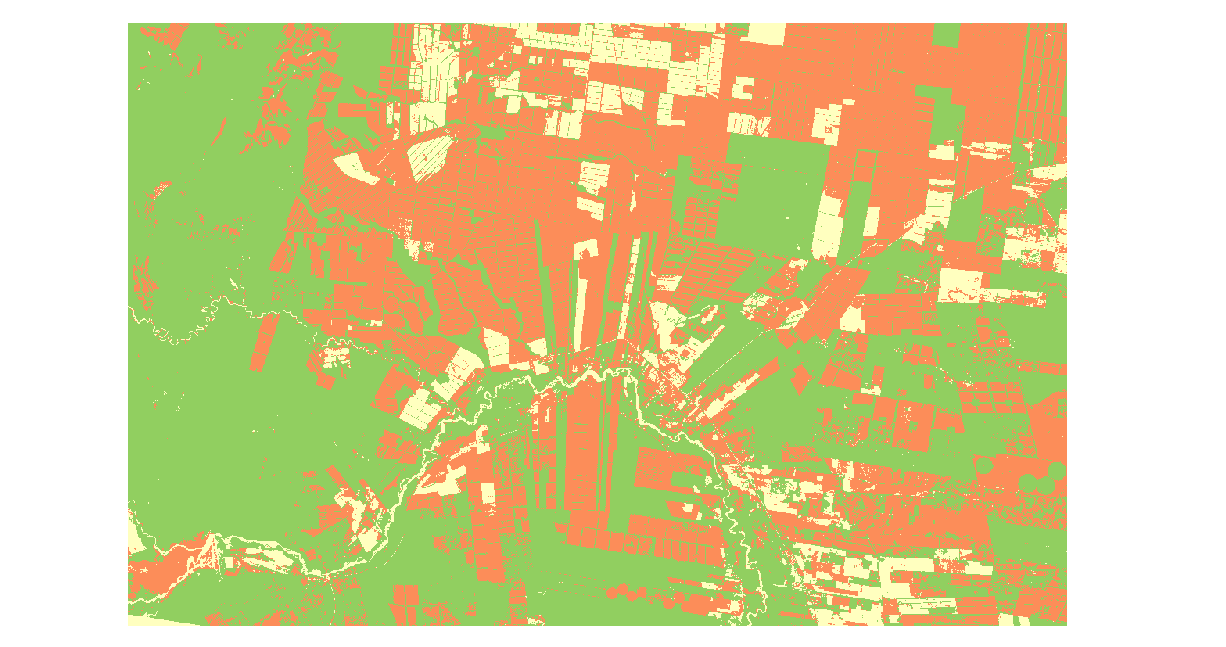
Deforestation map in Salta (1986-2017) - NDVI change analysis
Result
The map shows a clear pattern of reduction in green areas, corresponding to the expanding agricultural frontier. The technique allows quantification of the transformed area and localization of deforestation hotspots.
2. Fires in Patagonia
In 2015, a large-scale fire affected the Lago Cholila region (Chubut). This work evaluates damage severity using the Normalized Burn Ratio.
Methodology
- Landsat 8 images before (21/01/2015) and after (11/04/2015) the fire, path 232, row 89.
- Calculation of the Normalized Burn Ratio (NBR) for each scene:
NBR Formula:
NBR = (NIR - SWIR2) / (NIR + SWIR2)
- Obtaining the temporal difference (ΔNBR):
ΔNBR Formula:
ΔNBR = NBRpre - NBRpost
- Threshold classification into seven severity categories, from "vegetation regrowth" to "high fire severity".
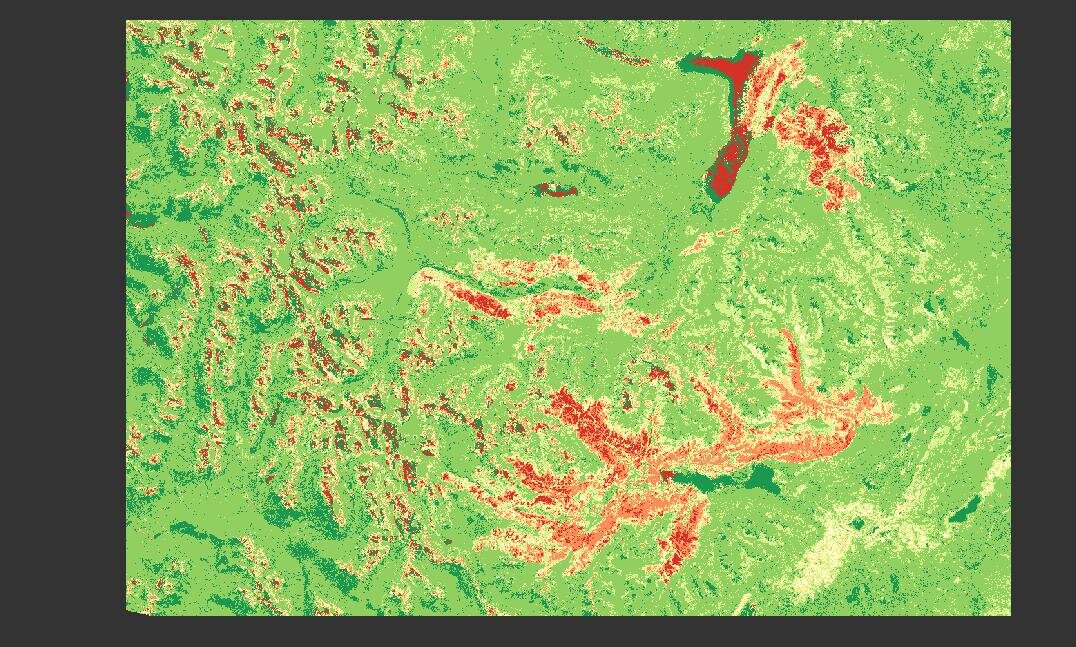
Fire severity map in Lago Cholila (2015) - ΔNBR analysis
Result
The fire core zone shows high ΔNBR values (red tones), indicating moderate-high severity. Peripheral areas show lower severity, while some green sectors suggest post-fire regrowth.
3. Seasonal snow and glacier dynamics in Cuyo
The Andean cryosphere is a strategic water reservoir. This analysis identifies permanent and seasonal snow cover in Cerro de la Majadita (San Juan) during 2018.
Methodology
- Landsat 8 images from summer (04/01/2018) and winter (15/07/2018), path 233, row 81.
- Calculation of the Snow Index (SI) for each date:
Snow Index Formula:
SI = Red / SWIR1
- Determination of a spectral threshold to discriminate snow-covered areas.
- Binary combination of summer and winter layers to obtain four classes:
- No snow
- Snow only in summer
- Snow only in winter
- Permanent snow (year-round)
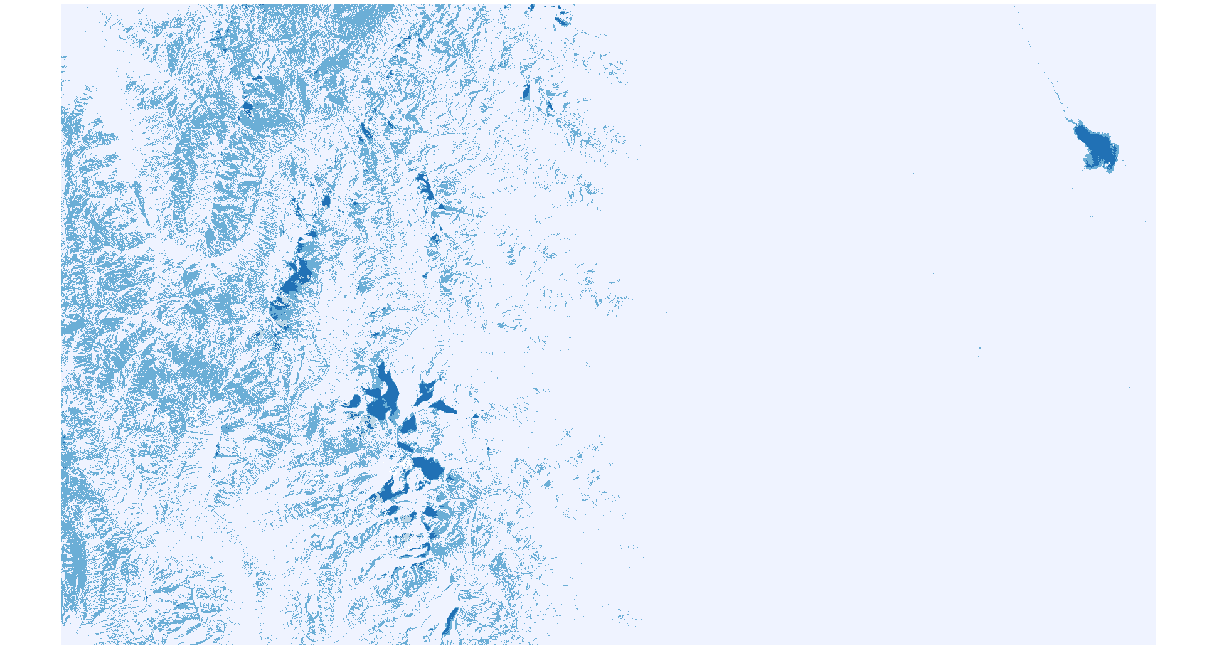
Seasonal snow/ice dynamics map in San Juan (2018) - Snow Index analysis
Result
Permanent snow/ice bodies (dark blue) are clearly identified, crucial for seasonal water supply. The distribution of seasonal snow reflects the altitudinal gradient and slope exposure.
Highlighted technical aspects
SoftwareProcessing performed with ESA SNAP, standard tool in optical remote sensing. |
DataLandsat Collection 2 Level 2 images, with atmospheric corrections already applied. |
Spectral indicesAppropriate selection according to the studied phenomenon (NDVI, NBR, SI). |
Temporal analysisMultitemporal comparison to capture change dynamics. |
Final reflection
These works demonstrate the capability of remote sensing to monitor environmental changes at regional scale with quantitative rigor. The selection of appropriate indices, consistent processing in SNAP, and contextual interpretation of results allow transformation of satellite data into useful information for territorial and environmental management.